
Shipyard AI, ProModel’s dedicated shipbuilding application, continues to evolve and develop new capabilities – With five software releases in 2019, desired improvements in shipyard capacity management, optimization, scheduling and process engineering have been realized. In addition, there has been a heavy emphasis on improving management’s ability to visualize shipyard production at both the strategic and tactical levels, at a single glance.
Building on a Strong Foundation
Historically, Shipyard AI has provided solid data and process information in highly detailed representations. The application has included the following key visualizations, which we’ve continued to refine and improve over the years.
The Laydown map provides a top-down view of the entire shipyard with animation showing the progress of ship construction over time.

Capacity Utilization Package (CUP) reports visualize resource utilization over time.

The Schedule screen features a Gantt chart representation of hull construction.

The Unit Template Tree report shows a hierarchical breakdown of a hull into its component grand blocks, blocks, panels, etc.

New Ways of Seeing the Shipyard
A recent emphasis on developing new types of visualizations is bearing fruit. This article introduces new ways of seeing the shipyard: the strategic Milestone Chart, the more tactical Location Resource View, and an updated Map Shapes editor.
Milestone Chart
A new Milestone Chart on the Hulls screen provides a strategic management view — visualizing the production of many hulls across long periods of time in a single view.

Location Resource View
The Location Resource View report shows unit placements over time grouped by location.
This view allows you to interface with a unit and its dependencies in a single action, reducing the time needed and the possible introduction of errors. It provides a visualization of space in the shipyard over time to help you quickly make re-planning decisions.

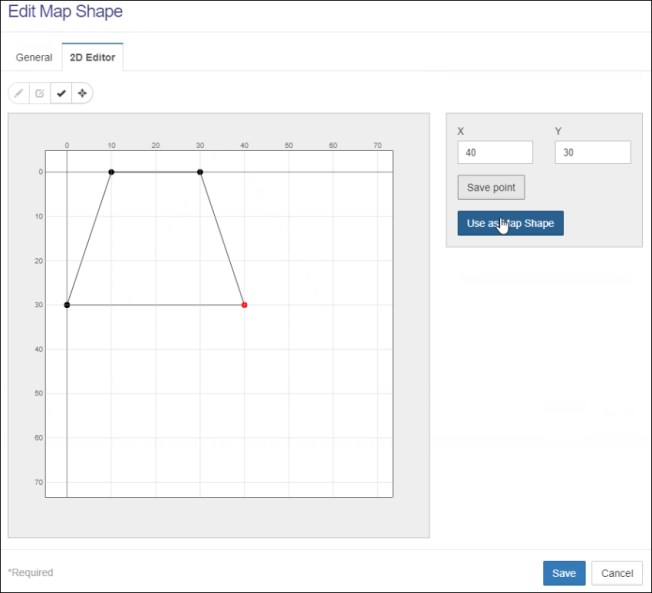
Map Shape Editor
In an upcoming release, we’ll provide a map shapes editor to allow you to quickly add and edit unit shapes.
You can assign map shapes at the unit template level to have units appear on the Laydown Map with the correct shape.
See the What’s New Shipyard AI Webpage for more details on this year’s releases.
 Huntington Ingalls Industries – Ingalls Shipbuilding (Ingalls) identified substantial savings potential in the lay-down placement and assignment process that had been previously utilized for managing asset location throughout the construction process.